XBox 360 Rapidfire Traceability Analysis
RapidFire Controller Signal Analysis, “Secure” Rapidfire Mods
Big Brother is watching you!#
Did you know, that a standard RapidFire controller mod is fully traceable by the game software ? No ? But it is true..
The trigger-signal-waveform can be analyzed as well as the statistical distribution of the trigger-down-time. In this post i will explain how it’s traceable and show you the best way to prevent your mod from beeing tracked!
Standard Mod ?#
What kinds of RapidFire mods are effected ? A standard mod means, that your mod based on one of the following forms:
- LED based RapidFire Mods
- NE555 or similar timer based Mods
- Microcontroller based, digital signal only Mods (on/off)
- Microcontroller based, non-random-time Mods
- Microcontroller based, non uniformly distributed random-time Mods
Test Setup#
The following tests will use a pc connected xbox360 controller with a matlab/simuink based analysis.
To running/reproduce the tests you need:
- XBox 360 Wired USB Controller (with RF)
- Matlab and Simulink (2011b recommended)
- Attached Simulink-Models and Matlab-Sourcefiles
Simulink Model#
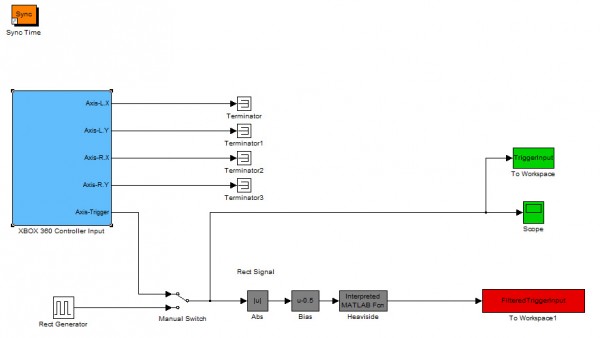
Thanks to Matlab and Windows7 you can directly grab data from a XBox 360 Controller by using the VirtualReality Toolbox Blockset (and please..buy a license..Matlab is a great Software and Student versions are avaible!). To get a more structured model i have created a submodel for the controller input capturing. The simulation model consists of two signal sources (controller and simulated timer) as well as some signal processing stuff. The recorded data is stored into the workspace as TriggerInput (RAW analog signal) and FilteredTriggerInput (filtered digital rect signal – required for edge and down-time recognition).
If you like to run your own statistical tests, the captured data is attached to this post.
XBox360 Controller Submodel#
Data recording Model#
Normal Behaviour#
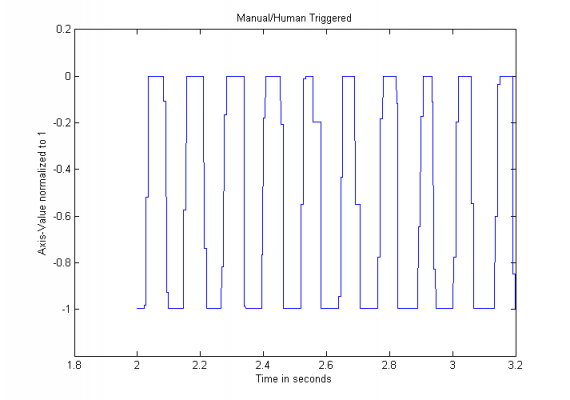
First of all we need some reference data from “normal” trigger actions. I have pressed the trigger as fast as i can for 10seconds.
Waveforms#
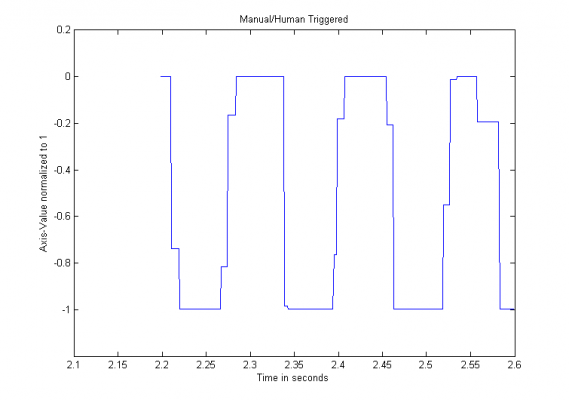
The waveform plots shows that a analog signal is captured from the usb controller (Simulink sample time 1kHz). The signal-edges are very preciptious, but the slope time is recognizable! Currently im not sure if the sampling rate of the USB-Driver/Simulink is fast enough to capture are more detailed slope. But i believe the XBox will receive a more detailed signal!
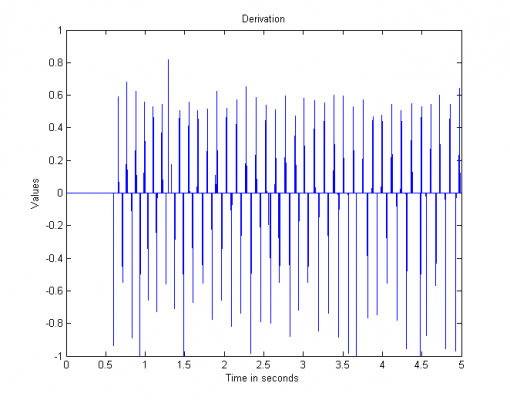
Analyzing the slope time is quite easy: just calculate the derivative of the signal. Considerung that a human will press the trigger with his finger the slope time can’t be infinite – or when using a 1-normalized signal |1|.
Signal Waveform-1s#
Note: pressing the right trigger down the value will be -1.0, releasing it 0.0 !
Signal Waveform-0.3s#
Waveform Derivative#
Caused by the limited sampling rate, some parts will have their peaks near 1.0/-1.0. To get a more manageable factor i use the mean value of the peaks of the derivative (@see function MeanSlopeRate). This factor will be the main indicator in this analysis to identify the waveform.
MeanSlopeRate: 0.5039 (this is our realistic reference value – bigger values mean a higher slope rate)
Signal Waveform – Slow press#
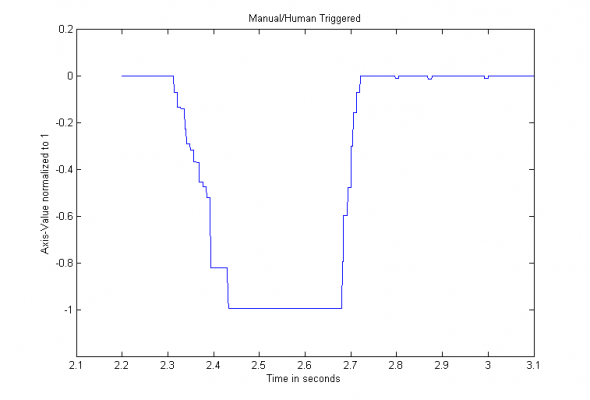
When pressing the trigger slow, you will better see the characteristical waveform of a trigger-event.
Statistical Analysis#
Well, you have seen that the waveform of the signal is an very important fact. But a much more powerful utility is the statistical analysis.
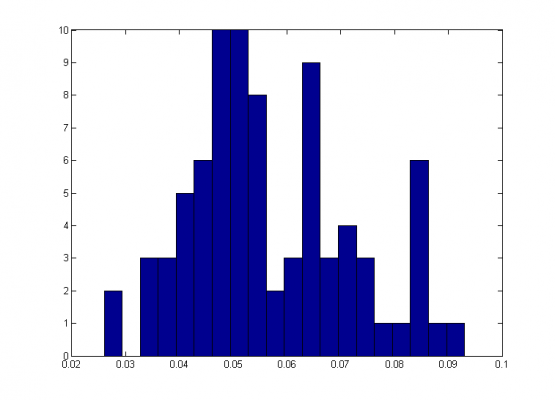
The function FindTriggerDownTimes calculates the trigger-down-times in seconds and outputs them as an vector (Note: use the FilteredTriggerInput, not the RAW signal). The output will displayed as a histogram (we could also use some hypothesis tests..)
Like in all “natural events” we estimate a gaussian normal distribution!
Standard deviation: 0.0152s
Histogram#
It looks like a gaussian distribution!
Results/Reference#
Also the trigger frequency is an important factor..values over ~15Hz are unrealistic!
Triggering frequency: size(FindTriggerDownTimes(TriggerFilteredManual))/10 = 8.1Hz
Analyzed mean-trigger-down-time: mean(FindTriggerDownTimes(TriggerFilteredManual)) = 0.057s
Standard deviation: std(FindTriggerDownTimes(TriggerFilteredManual)) = 0.0152s
MeanSlopeRate: MeanSlopeRate(TriggerManual) = 0.5039
Timer/Const-Time Rapidfire#
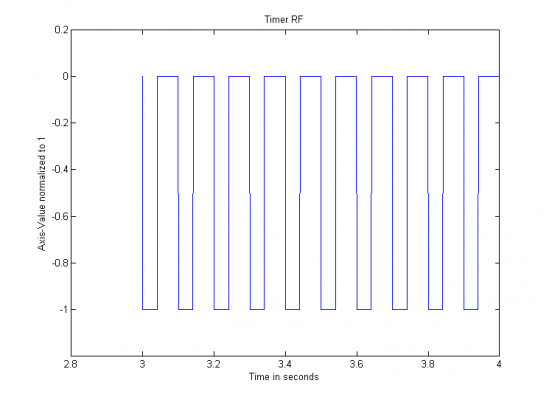
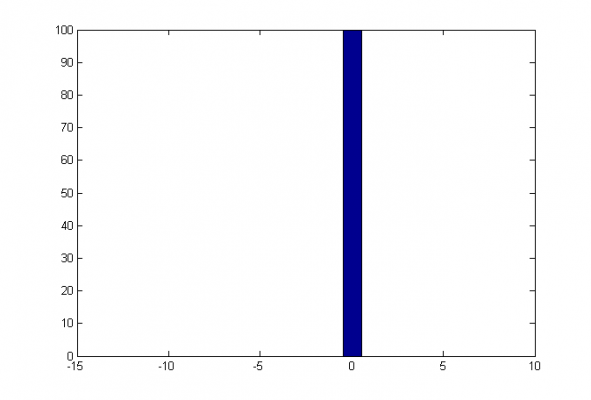
By using a simple rapidfire mod with a constant triggering time (non random: LED, NE555, Microcontroller) you get the following results: the trigger-down-times are absolutely constant, that means there is no statistical distribution like in all natural events. And there is no relevant signal slope time because of the digital output – by analysing the slopes (calculating derivatives) it is very easy reconizable..
Source frequency: 10Hz
Analyzed mean-trigger-down-time: 0.041s
Standard deviation: 0
MeanSlopeRate: 1
Result: RapidFire User ;)
Waveform#
Histogram#
AdvancedRapidFire#
To get more statistical relevant data, the simulation time is increased to 20seconds.
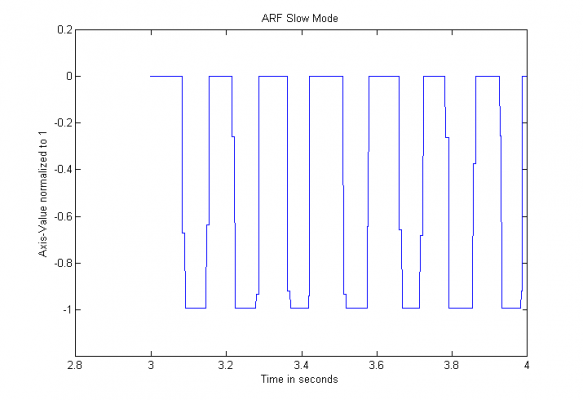
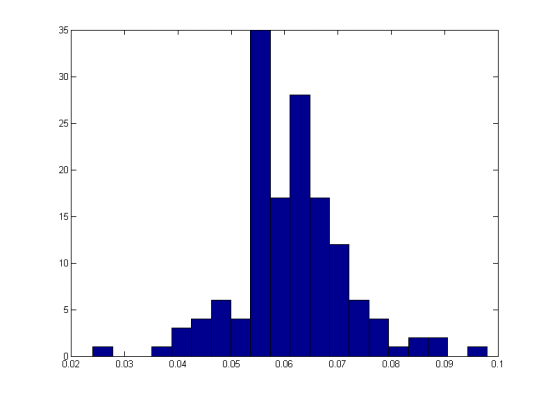
Slow Mode#
Oh well, the results look fine. The standard deviation could be bigger, but overall the result is perfect!
Triggering frequency: 7.2Hz
Analyzed mean-trigger-down-time: 0.0615s
Standard deviation: 0.0103s
MeanSlopeRate: 0.6297
Result: No RapidFire User
Slow-Mode Waveform#
Slow-Mode Histogram#
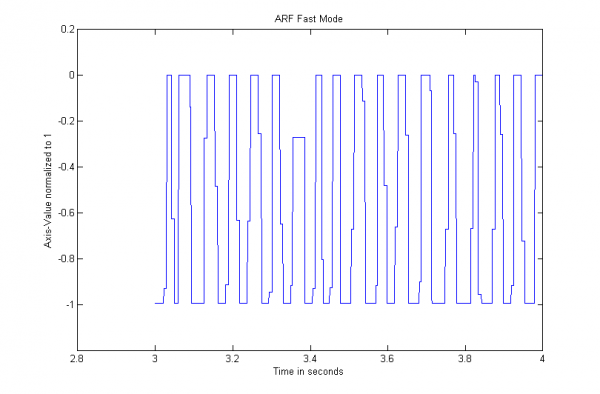
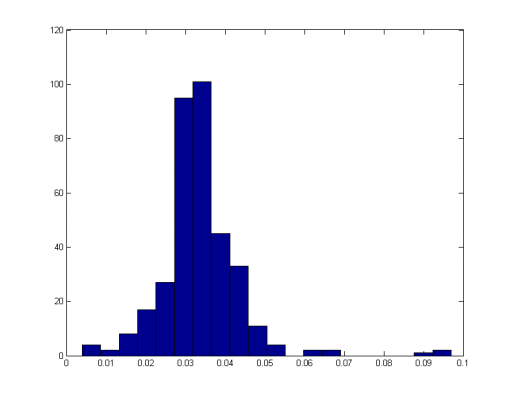
Fast Mode#
Generally the frequency is to high as well as the MeanSlopeRate – this mode should only be used if necessary!
Triggering frequency: 17.7Hz
Analyzed mean-trigger-down-time: 0.0615s
Standard deviation: 0.0103s
MeanSlopeRate: 0.7128
Result: No RapidFire User
Fast-Mode Waveform#
Fast-Mode Histogram#
Conclusion#
Advanced RapidFire#
Well..the variance of the probability distribution of my AdvancedRapidfireMod seems to be to small compared to the reference behaviour. I will release a new software version with improoved algorithms to provide an gaussian based normal-distribution.
Others..#
Other users should upgrade to mods like the AdvancedRapidFire mod to be untraceable.

